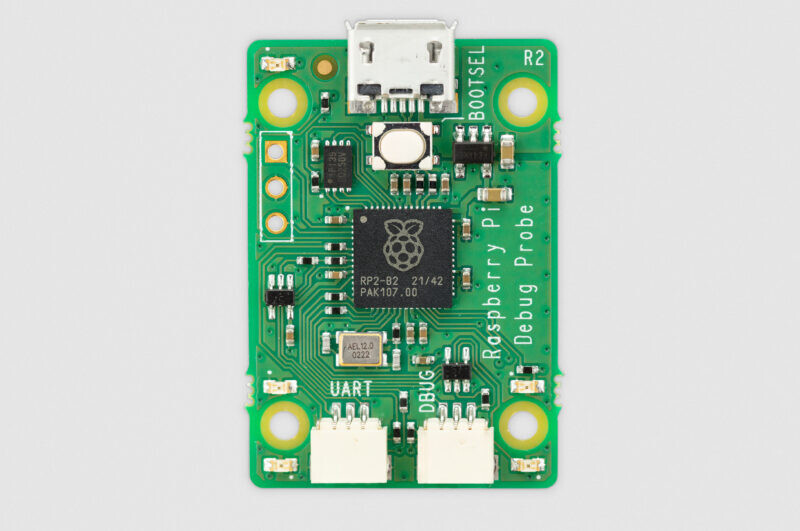
![Raspberry Pi Foundation launches $12 USB Debug Probe (a plug-and-play debug kit) .
The Raspberry Pi Foundation has a new gadget: a cheap, easy USB probe for debugging bare-metal code on a Pi Pico… but it should work with several other devices too.
The Debug Probe is a device to help debug bare-metal software on the Raspberry Pi Pico. The Pico is the Foundation's $4 single-board computer for microcontroller type roles. In embedded computers like this, there's often no display output, and in typical use, no operating system – both of which make it tricky to monitor what it's doing, or more to the point, work out why it's not doing it.
A common way to peer into the memory of an embedded Arm device and work out what it's doing is Arm's SWD interface, or Serial Wire Debug – broadly, Arm's three-wire version of the traditional four- or five-wire JTAG interface.
However, to use those SWD signals, you need a device to read and translate them into something another computer can read and interpret, using software such as the FOSS OpenOCD or pyOCD. (In this context, OCD stands for On-Chip Debugger.) This device is called a debug probe.
Conveniently, a Raspberry Pi's GPIO interface can talk SWD over a few of its pins [PDF]. This means you can use one Pi to debug another Pi. That even includes the Pi Pico using some special firmware called Picoprobe. This is rather cheaper than a dedicated hardware debug probe. The snag is that you'll still need to wire up some circuits, as this blogpost describes.
Even if it's versatile – for instance, you can also use SWD to upload software into a Pi Pico from another Pi – it's not that easy, and if you want to use a bigger, faster computer, such as a PC or Mac, you then need to interface your Pi-based probe to that.
--- What is a debug probe? ---
All modern Arm-based microcontrollers, including RP2040, implement Arm’s CoreSight debug architecture. Each processor core, like the Cortex-M0+ used in RP2040, provides an Access Port (AP) which can be used to single step, set breakpoints, observe the values of processor registers, and access memory and peripherals via the processor’s bus interface.
The microcontroller itself provides a Debug Port (DP), which is connected externally to pins on the package, and internally to each AP in the system. RP2040 exposes its DP via a low-pin-count Serial Wire Debug (SWD) port: by talking the SWD protocol over this port, a host computer can control each core’s AP, in order to debug a program running on the core.
A debug probe provides a bridge between USB and the SWD protocol. While not strictly required if the host computer is a Raspberry Pi (you can wire up the target’s SWD port directly to the GPIO header on a Raspberry Pi), it’s much more convenient to connect via USB. And if you’re using a PC or Mac, USB is your only option.](https://old.pichost.net/i/2023/02/23/DEBUG_PROBE_PCB_TOP-800x531e1d2b3e4da9781a0.md.jpg)
Raspberry Pi Foundation launches $12 USB Debug Probe (a plug-and-play debug kit) .
The Raspberry Pi Foundation has a new gadget: a cheap, easy USB probe for debugging bare-metal code on a Pi Pico… but it should work with several other devices too.
The Debug Probe is a device to help debug bare-metal software on the Raspberry Pi Pico. The Pico is the Foundation's $4 single-board computer for microcontroller type roles. In embedded computers like this, there's often no display output, and in typical use, no operating system – both of which make it tricky to monitor what it's doing, or more to the point, work out why it's not doing it.
A common way to peer into the memory of an embedded Arm device and work out what it's doing is Arm's SWD interface, or Serial Wire Debug – broadly, Arm's three-wire version of the traditional four- or five-wire JTAG interface.
However, to use those SWD signals, you need a device to read and translate them into something another computer can read and interpret, using software such as the FOSS OpenOCD or pyOCD. (In this context, OCD stands for On-Chip Debugger.) This device is called a debug probe.
Conveniently, a Raspberry Pi's GPIO interface can talk SWD over a few of its pins [PDF]. This means you can use one Pi to debug another Pi. That even includes the Pi Pico using some special firmware called Picoprobe. This is rather cheaper than a dedicated hardware debug probe. The snag is that you'll still need to wire up some circuits, as this blogpost describes.
Even if it's versatile – for instance, you can also use SWD to upload software into a Pi Pico from another Pi – it's not that easy, and if you want to use a bigger, faster computer, such as a PC or Mac, you then need to interface your Pi-based probe to that.
--- What is a debug probe? ---
All modern Arm-based microcontrollers, including RP2040, implement Arm’s CoreSight debug architecture. Each processor core, like the Cortex-M0+ used in RP2040, provides an Access Port (AP) which can be used to single step, set breakpoints, observe the values of processor registers, and access memory and peripherals via the processor’s bus interface.
The microcontroller itself provides a Debug Port (DP), which is connected externally to pins on the package, and internally to each AP in the system. RP2040 exposes its DP via a low-pin-count Serial Wire Debug (SWD) port: by talking the SWD protocol over this port, a host computer can control each core’s AP, in order to debug a program running on the core.
A debug probe provides a bridge between USB and the SWD protocol. While not strictly required if the host computer is a Raspberry Pi (you can wire up the target’s SWD port directly to the GPIO header on a Raspberry Pi), it’s much more convenient to connect via USB. And if you’re using a PC or Mac, USB is your only option.
